SCA Report
Goal: Work with your city’s and sector’s SCA report(s). Ideally, you collect your findings and write a report per sector.
Approach: You can simply write a report in whichever form you like, in a word document for example. If you wish to make an interactive online report on the CityLoops Data Hub, with the help of a form for your city and sector, please get in touch with Metabolism of Cities (info[at]metabolismofcities.org) to inquire about this option.
Be sure to refer to some of the existing SCA reports to get an idea what they can look like.
Content
Depending on data availability and efforts, the report can be anywhere from 15-50 pages long (without references). The final report should contain the following:
- some general statistics around the city (urban context) and the sector,
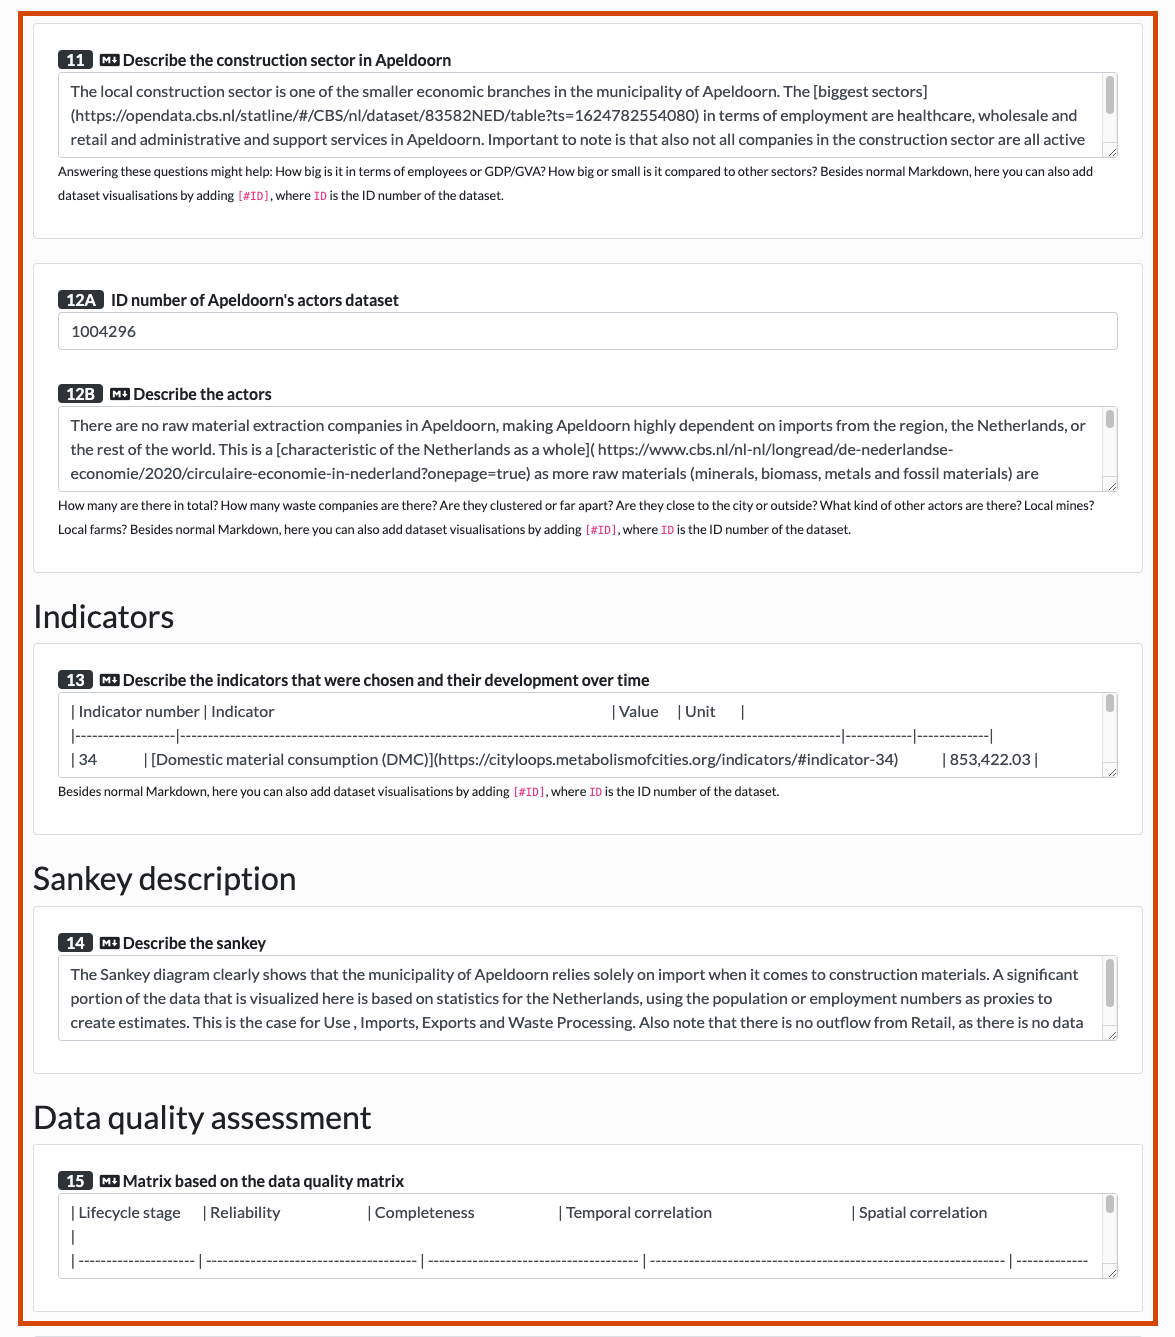
- a Sankey diagram, as well as many visualisations from single datasets (that are generated on the Data Hub), to provide supporting information,
- insights from the data analysis, including the indicator evaluation,
- reflections on how to upscale and expand certain projects to make a sector more circular.
Process with the SCA online report form
You can use a SCA online report form for your city and fill in the predetermined fields to later on have an interactive online report that can be easily shared with others.
- Cover image: Add a cover image if you don’t have one yet. If you do have one, you can still decide if you’d like to keep this one or change it. If it is very pixelated / low resolution, we recommend that you change it. Otherwise it doesn’t look that good in the report. Have a look at Module 2 - video 5 of the first courses to see how photo management is done.
- City boundary: Make sure your city boundary is set, otherwise the map will not show up correctly. You can check here if your city boundary is set.
- Land use map: Get your land use map ready. It should not have more than 24 land use types. For example, there is a nice one for Apeldoorn, for example. The one for Porto has 685 items, which is too much. Try to process again with grouping by type.
- Actors map: Get your actors map ready. You uploaded data on farms, mines, waste treatment companies. These are the ones with the GPS coordinates. Make sure that they are processed.
- Form: Try to fill in some of the fields and click on save. If you already know which reference year you will be using, then you can already look up the population numbers, area sizes for different scales for the reference year. You can also test the markdown language and an ID for a dataset, but this is optional.
- Indicator selection: Get your indicators ready and fill in the data.
Outline of the video
- M5 is more of a technical module, not so much around content and processing. So you can use any additional time to work on your data.
- The SCA report is the main output that you need to be focusing on for now. It is made up of the single elements that you have been working on and will still produce, such as the Sankey diagram and the indicators.
- There is a report template which dictates the structure: Urban context, economic context, indicators, visualisations, data gap analysis, data analysis.
- A lot of the elements in the report are pulled in automatically from your city dashboard. The cover image, some of the maps. The fields that are still empty can be filled in through a form that you will fill in.
- Before showing you the form, here is the structure in an overview, for you to understand what is pulled in from the system and what you have to add.
- Report writing with the help of the form. Fill in the different fields. Make use of the ID function (fingerprint of a data item) and the Markdown function.
- Once you have clicked save, you can always come back to edit it.
- Cities can use the data article to take notes here from now on.
- However, we can also recommend that you draft your input in a shared google doc, especially if several people work on a city report.