Proxies
For the different lifecycle stages (LCS) or material groups and the various data used therein, different proxies need to be applied. Here are some suggestions as to what proxies and datasets (for EU countries) can be used to downscale them for the city.
Proxies
There are a total of 6 proxies:
- (Agricultural) Area / land use
- Persons employed / employee numbers
- GDP
- Population
- Number of buildings / farms
- Income (household budget survey)
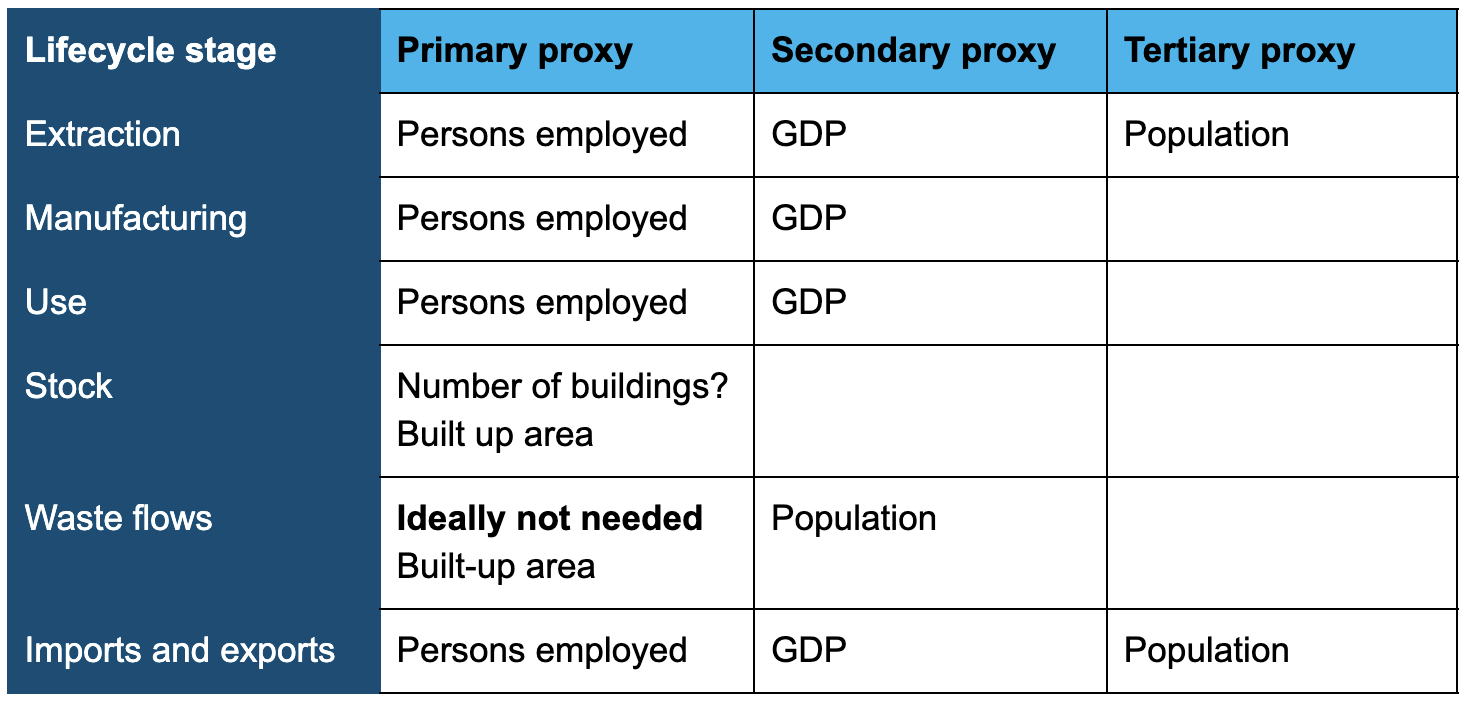
The primary proxy in the table is the preferred one. For example, in the case of extraction, “persons employed“ is more suitable than “GDP”. If data is not available or cannot be found for the primary proxy, the secondary proxy should be used and so on.
Proxy overview for construction sector / materials
Proxy overview for biomass sector / materials

Proxy data
Agricultural area
If you don’t find your own agricultural area, start by looking whether your NUTS 3 or NUTS 2 area has any (for instance look here for NUTS 2 and vegetables). If you do not know your agricultural area, then you can make a ratio of domestic extraction: If agricultural area is reported in total for your city, then find out the agricultural area of the country, make a share based on domestic extraction at a country level and apply that share to the city level.
Employees / Persons employed
- Formula: Extraction in weight per city = Quantity of extraction in country / employees per sector in the country * employees per sector in the city
- Definition of persons employed
- Data sources:
- For employees in sector on NUTS2: Structural business statistics (SBS) data by NUTS 2 regions and NACE Rev. 2 (from 2008 onwards); > Structural business statistics data
- “Structural business statistics (SBS) describe the structure and performance of businesses in the EU. They cover the 'business economy' (NACE Rev. 2 sections B to N and division 95) which includes: Industry; Construction; Distributive trades; and Services.”
- NACE B-N: SBS data by NUTS 2 regions and NACE Rev. 2 (from 2008 onwards) [sbs_r_nuts06_r2]; NUTS 2, NACE level 2
- NACE B-E: Annual detailed enterprise statistics for industry (NACE Rev. 2, B-E) [sbs_na_ind_r2]; National, NACE level 4
- NACE G, Trade: Annual detailed enterprise statistics for trade (NACE Rev. 2 G) [sbs_na_dt_r2]; National, NACE level 4
- NACE H-N, services: Annual detailed enterprise statistics for services (NACE Rev. 2 H-N and S95) [sbs_na_1a_se_r2]; National, NACE level 4
- NACE F, Construction: Annual detailed enterprise statistics for construction (NACE Rev. 2, F) [sbs_na_con_r2] , with several economical indicators: Persons employed / Employees / Enterprises and with several levels of NACE, incl. NACE level 4, e.g. F4311 Demolition, scale: national
- Agricultural statistics, > Farm structure > Farm structure 2008 legislation > Overview farm labour force; Labour force: number of persons and farm work (AWU) by type of farming (2-digit) and economic size of farm (SO in Euro) [ef_olfftecs]
- Employment (thousand persons) by NUTS 3 regions, here linked in the library, only NACE level 1; with an example of Employed per. industry (level 2) in Denmark
- Employment levels for cities
- Employees by economic activity sector - Porto; Quite nice data from 2008-2018, showing people employed in Porto for NACE level 2.
- Jobs of employees from country - city level dec 2010 - dec 2019; Jobs per SBI code first level at national, NUTS2, NUTS3 and city level - great that it is on all 3 levels right away. It is a bit hard to read the data, maybe it can be downloaded better.
- Apeldoorn City employment 2000-2019; City employment based upon yearly provincial employment questionnaire from 2000-2019. Data categorised per SBI-section (Dutch NACE), first level. Data can be further specified to district and neighbourhood level. Would need a good correspondence to NACE, but SBI is the “Dutch NACE” so it should be doable.
GDP
- Revenue, Revenue per industry at national, NUTS2 and NUTS3 level, 2016-2017; Revenue on 3 levels, for 2 years, but NACE level not that great.
- GVA, GVA by economic activity - Porto